
Cross-market price study
Gulf car prices: how Saudi Arabia stacks up vs Qatar & the UAE
The same car can be worth thousands more depending on where in the Gulf you buy it. We compared the typical price of 264 model-and-year groups across Qatar, the UAE and Saudi Arabia, in US dollars.
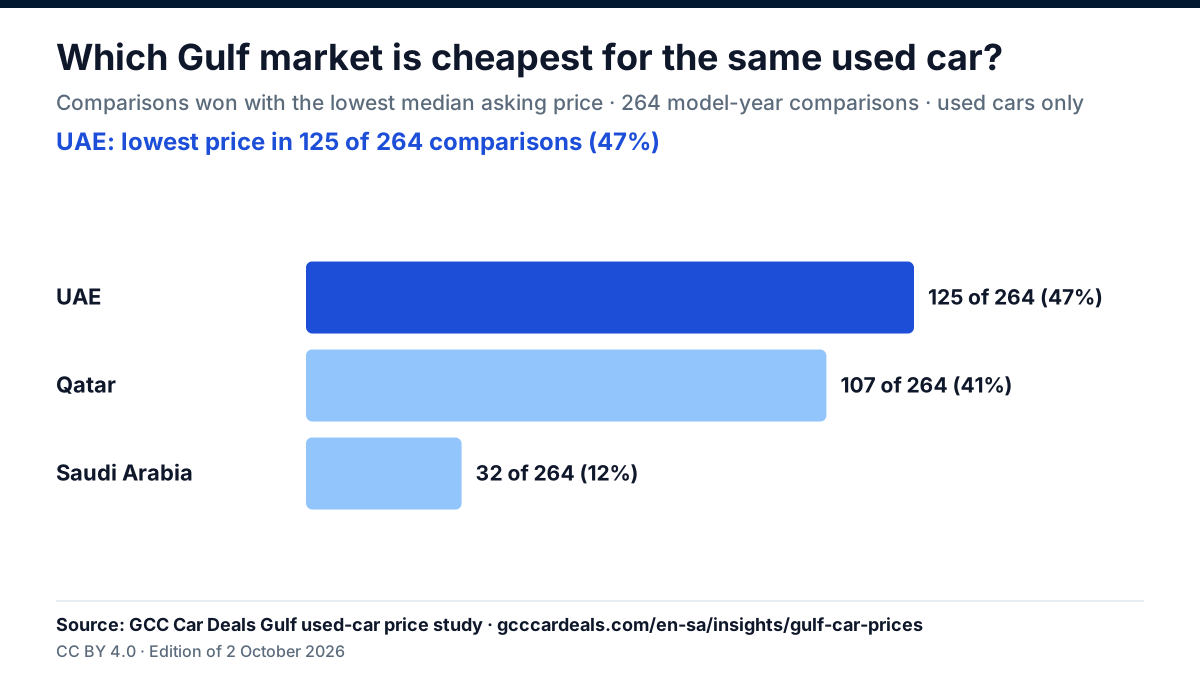
Comparing the same make, model and year across Qatar, the UAE and Saudi Arabia (264 comparisons), UAE takes the lowest price most often — a median 25% gap between the cheapest and priciest market. Saudi Arabia is usually the most expensive of the three.
Find your car
Pick a model to compare median asking prices across the Gulf.
Explore every comparison
All 264 model-year comparisons — search, sort and filter to find yours.
| Model | Qatar | UAE | Saudi Arabia | Gap | Asking-price gap |
|---|---|---|---|---|---|
| Dodge Charger 2023Thin sample | $43,942 | $24,479 | $43,867 | 80% | $19,463 |
| Land Rover Range Rover 2015Medium confidence | $17,033 | $15,248 | $27,333 | 79% | $12,085 |
| Toyota Camry 2022Medium confidence | $11,676 | $18,788 | $20,800 | 78% | $9,124 |
| Ford Edge 2013Thin sample | $5,632 | $4,084 | $7,200 | 76% | $3,116 |
| GMC Yukon 2009Thin sample | $4,533 | $5,990 | $8,000 | 76% | $3,467 |
| Mazda CX 9 2014Thin sample | $7,967 | $5,718 | $9,867 | 73% | $4,149 |
| Toyota Camry 2013Medium confidence | $5,158 | $4,425 | $7,467 | 69% | $3,042 |
| Chevrolet Malibu 2016Thin sample | $4,121 | $4,221 | $6,933 | ≈ | — |
| Nissan Patrol 2014Medium confidence | $11,951 | $13,615 | $20,000 | 67% | $8,049 |
| Toyota Camry 2011Medium confidence | $4,121 | $3,676 | $6,133 | 67% | $2,457 |
| Toyota Camry 2007Medium confidence | $3,434 | $2,995 | $5,000 | 67% | $2,005 |
| Mercedes-Benz S Class 2014Thin sample | $19,080 | $20,422 | $31,333 | 64% | $12,253 |
| Kia Cerato 2019Thin sample | $5,357 | $6,807 | $8,800 | 64% | $3,443 |
| Nissan Sentra 2016Thin sample | $4,121 | $4,084 | $6,667 | ≈ | — |
| Nissan Pathfinder 2013Thin sample | $6,868 | $4,901 | $8,000 | 63% | $3,099 |
| Kia Sportage 2015Thin sample | $8,173 | $5,718 | $9,333 | 63% | $3,615 |
| Dodge Ram 1500 2019Thin sample | $23,764 | $20,694 | $14,667 | 62% | $9,097 |
| GMC Yukon 2012Thin sample | $6,593 | $7,080 | $10,667 | 62% | $4,074 |
| Jeep Grand Cherokee 2014Thin sample | $12,637 | $7,897 | $11,867 | 60% | $4,740 |
| Toyota Camry 2017Thin sample | $9,615 | $6,807 | $10,667 | 57% | $3,860 |
| Toyota Camry 2021Medium confidence | $13,187 | $19,469 | $20,667 | 57% | $7,480 |
| Dodge Charger 2013Thin sample | $7,692 | $4,901 | $6,667 | 57% | $2,791 |
| Porsche Cayenne 2013Medium confidence | $11,264 | $9,258 | $14,400 | 56% | $5,142 |
| Toyota Land Cruiser 2002Thin sample | $9,615 | $8,305 | $12,933 | 56% | $4,628 |
| BMW 7 Series 2019Thin sample | $23,077 | $23,009 | $35,733 | ≈ | — |
| Ford Edge 2014Thin sample | $5,082 | $4,765 | $7,333 | 54% | $2,568 |
| Lexus LX 570 2013Medium confidence | $21,703 | $23,962 | $33,333 | 54% | $11,630 |
| Jeep Grand Cherokee 2013Thin sample | $8,104 | $7,080 | $10,933 | 54% | $3,853 |
| Jeep Grand Cherokee 2021Medium confidence | $34,341 | $22,328 | $22,667 | ≈ | — |
| GMC Yukon 2008Thin sample | $4,670 | $5,174 | $7,200 | 54% | $2,530 |
| Nissan Kicks 2020Thin sample | $9,341 | $7,828 | $12,000 | 53% | $4,172 |
| Ford Explorer 2013Thin sample | $6,497 | $5,446 | $8,267 | 52% | $2,821 |
| Lexus LX 570 2014Medium confidence | $24,588 | $25,419 | $37,333 | 52% | $12,745 |
| Land Rover Range Rover Sport 2024Thin sample | $114,011 | $156,569 | $102,800 | 52% | $53,769 |
| Chevrolet Malibu 2013Thin sample | $3,709 | $2,995 | $4,533 | 51% | $1,538 |
| Land Rover Range Rover 2014Thin sample | $14,835 | $13,342 | $20,000 | 50% | $6,658 |
| BMW 7 Series 2016Medium confidence | $17,033 | $18,788 | $25,333 | 49% | $8,300 |
| BMW 7 Series 2012Thin sample | $7,486 | $6,263 | $9,333 | 49% | $3,070 |
| GMC Yukon 2019Thin sample | $24,588 | $20,830 | $31,067 | 49% | $10,237 |
| Kia Rio 2020Thin sample | $5,357 | $6,467 | $8,000 | 49% | $2,643 |
| Toyota Corolla 2019Thin sample | $10,027 | $9,122 | $13,467 | 48% | $4,345 |
| Ford Bronco 2023Thin sample | $76,648 | $51,736 | $59,200 | 48% | $24,912 |
| Toyota Prado 2006Thin sample | $6,868 | $8,169 | $10,133 | 48% | $3,265 |
| Kia Rio 2014Thin sample | $3,640 | $3,268 | $4,800 | 47% | $1,532 |
| Nissan Sunny 2015Thin sample | $3,297 | $3,268 | $4,800 | ≈ | — |
| Mercedes-Benz S Class 2015High confidence | $22,802 | $23,553 | $33,333 | 46% | $10,531 |
| GMC Sierra 2015Thin sample | $13,736 | $14,568 | $20,000 | 46% | $6,264 |
| Mazda CX 9 2015Thin sample | $8,448 | $6,399 | $9,333 | 46% | $2,934 |
| Nissan Pathfinder 2022Thin sample | $30,357 | $22,600 | $33,067 | 46% | $10,467 |
| Nissan Sunny 2020Medium confidence | $6,044 | $5,160 | $7,467 | 45% | $2,307 |
| Hyundai Accent 2019Thin sample | $7,473 | $5,500 | $8,000 | 45% | $2,500 |
| Nissan Patrol 2015Medium confidence | $14,835 | $14,976 | $21,333 | ≈ | — |
| Chevrolet Tahoe 2020Medium confidence | $24,451 | $20,422 | $29,333 | 44% | $8,911 |
| Land Rover Range Rover 2016Medium confidence | $20,192 | $18,652 | $26,667 | 43% | $8,015 |
| Lexus LX 570 2015Medium confidence | $28,846 | $29,952 | $41,333 | 43% | $12,487 |
| Kia Sportage 2024Thin sample | $26,374 | $20,830 | $18,400 | 43% | $7,974 |
| Jeep Grand Cherokee 2023Thin sample | $49,313 | $34,581 | $37,867 | 43% | $14,732 |
| Chevrolet Tahoe 2012Medium confidence | $7,280 | $6,882 | $9,867 | 43% | $2,985 |
| Nissan Patrol 2019Thin sample | $23,077 | $22,600 | $32,000 | ≈ | — |
| Toyota Camry 2008Medium confidence | $3,297 | $2,995 | $4,267 | 42% | $1,272 |
Biggest price gaps
The same car, widest price gap between the cheapest and priciest Gulf market.
Cheapest by make
Which market takes the lowest price most often, brand by brand.
| Model | Which country is cheapest most often | comparisons | Gap | sum of asking-price gaps |
|---|---|---|---|---|
| Toyota | Qatar | 69 | 21% | $235,525 |
| Nissan | UAE | 23 | 35% | $103,965 |
| Chevrolet | Qatar | 21 | 25% | $79,144 |
| Mercedes-Benz | UAE | 21 | 24% | $197,316 |
| Land Rover | Saudi Arabia | 20 | 22.5% | $257,107 |
| Kia | UAE | 18 | 32% | $50,994 |
| GMC | Qatar | 16 | 25.5% | $89,530 |
| BMW | Qatar | 15 | 28% | $108,945 |
| Lexus | Qatar | 12 | 19% | $130,343 |
| Jeep | UAE | 9 | 37% | $63,519 |
| Ford | UAE | 8 | 43.5% | $51,538 |
| MG | UAE | 7 | 16% | $8,719 |
| Mitsubishi | UAE | 6 | 24.5% | $15,561 |
| Dodge | UAE | 5 | 57% | $39,508 |
| Porsche | UAE | 3 | 20% | $15,897 |
| Honda | Qatar | 2 | 13% | $2,923 |
Gulf Car Price Study Vehicle Directory
Cross-border asking-price comparisons across Qatar, the UAE, and Saudi Arabia for 47 tracked models.
Cars priced below other Gulf markets
See which cars cost less in one Gulf country than in another, and the profit left after shipping and fees. For dealers who buy and sell across borders.
How we compare
Median asking price of the cars listed for the same make, model and year: at least 6 distinct cars per market, a car advertised on several sites counting once, USD-normalized at the fixed pegs. The study compares used cars: a model year is left out when more than 25% of its cars in any of the three markets are listed as new. Trims are mixed within a model-year, so very wide gaps can reflect trim mix, not market; model-years more than 80% apart are left out. A market is only called cheapest when it leads by at least 3%. As of 2026-10-02.
GCC Cross-Border Used Car Price Study
Dataset snapshot as of 2026-10-02 · Open access for media, analysts, and academic research under CC-BY 4.0
60-Second Executive Summary for Newsrooms & Editors
In the 2026-10-02 snapshot, the median asking-price gap is 25% across 264 make, model and year comparisons. The sum of their median-price gaps is $1,475,837; this is an arithmetic total across comparisons, not market value or attainable buyer savings.
Qatar (107) and the UAE (125) hold the lowest price in 88% of comparisons, whereas Saudi Arabia is the most expensive in 70% and the cheapest in only 32 (12%).
It compares listed asking prices only. It does not measure transaction prices, depreciation or resale value, and it does not model import duty, VAT, registration or shipping between countries.
Truth & Integrity Matrix: Observed Evidence vs. Inferred Analysis
We maintain strict linguistic boundaries so journalists, researchers, and consumers understand exactly what our data captures.
| Directly Observed Facts | Statistically Inferred Models | Explicitly Not Claimed |
|---|---|---|
| Exit Asking PricesAdvertised asking price recorded across monitored portals at the moment of listing removal. | Estimated Sales VelocityTurnover velocity modeling separating high-probability sales from 30-day expiration cliffs and relists. | Closed DMV Registry PricesNo access to final cash-in-hand negotiated discounts or official traffic department registration deeds. |
| Listing DurationExact timestamped calendar days from first crawl detection to listing removal. | Cheapest Market per ModelWhich of the three markets lists the same make, model and year lowest, compared on median asking prices converted at the official USD pegs. | Causal Policy DeterminationsWe report measured price dispersion; we leave macroeconomic and tariff causation to industry economists. |
Top Confident Cohort Case Studies for Coverage (nMin ≥ 10)
Cohorts with at least 10 cars in every market and a clear cheapest market (ahead of the runner-up by 3% or more); thin samples and implausible spreads (over 80%) are filtered out. One case study per model, the widest gap first.
Saudi Arabia cheapest, UAE priciest, with at least 11 cars in every market
Saudi Arabia cheapest, UAE priciest, with at least 27 cars in every market
Saudi Arabia cheapest, Qatar priciest, with at least 19 cars in every market
Qatar cheapest, Saudi Arabia priciest, with at least 15 cars in every market
Qatar cheapest, UAE priciest, with at least 25 cars in every market
Dataset Scope & Sampling Methodology
- Geographic Scope: Qatar, United Arab Emirates, and Saudi Arabia.
- Cohort Criteria: Strict make, model, and year matching with at least 6 distinct priced cars per market (a car advertised on several sites counts once). Used cars only: a model year is left out when more than 25% of its cars in any of the three markets are listed as new.
- Currency Normalization: Standardized to USD at official GCC central bank dollar pegs (QAR 3.64, AED 3.67, SAR 3.75).
- Outlier Sanitation: The median, not the mean, per market; model-years whose cheapest-to-priciest spread exceeds 80% are left out as thin or trim-mixed cohorts.
Known Limitations & Refresh Cadence
- Trim-Mix Variation: Options and trim lines vary within single model-years; we highlight confident cohorts (nMin ≥ 10) to mitigate mix bias.
- Mileage Distribution: The study compares asking prices without adjusting for mileage. A separate check (October 2026) found the cheapest market was no more likely than chance to hold the highest-mileage cars, so mileage does not explain the rankings overall, though it can for an individual model.
- Update Frequency: The cross-market study is a dated snapshot (2026-10-02), refreshed by hand; sales velocity refreshes daily; the weekly pulse is published weekly.
- Open Citation License: Free to cite in media and academic publications with source attribution to GCC Car Deals (CC-BY 4.0).
Key research findings for press & analysts
Study snapshot: 2 October 2026
Copy or download the editable brief with its sample sizes, method, limitations and source link.
Read the brief, method and limitations
Editorial brief: Gulf used-car asking-price differences

Snapshot dated 2 October 2026: the median gap between the lowest and highest median asking prices was 25% across 264 matched make, model and year comparisons in Qatar, the UAE and Saudi Arabia. Each gap is measured as a percentage of the lowest market median.

83 comparisons have at least 10 cars in every market and a runner-up median at least 3% higher than the lowest median. Lowest-market counts within this subset: Qatar: 36; UAE: 37; Saudi Arabia: 10. This is a subset of the published comparisons, not market share or a statistical significance test.

Method: at least 6 distinct priced cars per market; a car advertised on multiple sites counts once. A model-year is excluded if cars labelled new exceed 25% in any market, or if the gap exceeds 80%. Prices are converted to USD at currency pegs. This snapshot is refreshed by hand, not a live series.

Limitations: matching is by make, model and year, without adjustments for trim, mileage or condition. Coverage is monitored listings, not every car in the market. These are asking prices, not completed transactions; shipping, taxes, import duties and registration costs are not included. The study does not measure buyer savings, depreciation or the causes of price differences.

Source: GCC Car Deals. (2026, October 2). Gulf Car Price Gap Study [Data set]. https://gcccardeals.com/en-sa/insights/gulf-car-prices
https://gcccardeals.com/en-sa/insights/gulf-car-prices
CSV: https://gcccardeals.com/api/data/gulf-car-prices
CC BY 4.0: https://creativecommons.org/licenses/by/4.0/
Cite this research & dataset
GCC Car Deals. (2026, October 2). Gulf Car Price Gap Study: used-car prices across Qatar, the UAE and Saudi Arabia [Data set]. https://gcccardeals.com/en-sa/insights/gulf-car-prices
- Page
- https://gcccardeals.com/en-sa/insights/gulf-car-prices
- Data as of
- Licence
- CC BY 4.0: free to reuse, including in print and commercially, with credit to GCC Car Deals and a link to this page.
Automotive journalists, market analysts, and academic researchers may quote these findings freely with credit to GCC Car Deals.
Charts for your story
Each chart carries its source and date. Download it as a PNG, link the SVG, or embed it with a link back to this data.
Which Gulf market is cheapest for the same used car? Embed code
The code shows the chart and links to the page it comes from.
<a href="https://gcccardeals.com/en-sa/insights/gulf-car-prices?ref=chart"><img src="https://gcccardeals.com/api/data/charts/gulf-cheapest-sa-en.svg" width="600" height="338" alt="Which Gulf market is cheapest for the same used car? - GCC Car Deals" loading="lazy"></a>
Frequently asked questions
Which Gulf country has the cheapest used-car prices?
Comparing the same make, model and year across Qatar, the UAE and Saudi Arabia (264 comparisons), UAE takes the lowest price most often — a median 25% gap between the cheapest and priciest market. Saudi Arabia is usually the most expensive of the three.
How big is the price gap between Qatar, the UAE and Saudi Arabia?
About 25% typically between the cheapest and priciest market for the same car; on some models it tops 50%.
Why are the prices shown in US dollars?
All three currencies are pegged to the US dollar, so USD gives a like-for-like comparison free of exchange-rate noise.
How current are these prices and how are they calculated?
They're the median asking price of the cars listed for the same make, model and year — at least 6 distinct cars per market, a car advertised on several sites counting once — converted to USD at the fixed pegs. The study compares used cars: a model year is left out when more than 25% of its cars in any of the three markets are listed as new. A dated snapshot, refreshed by hand: as of 2026-10-02.